
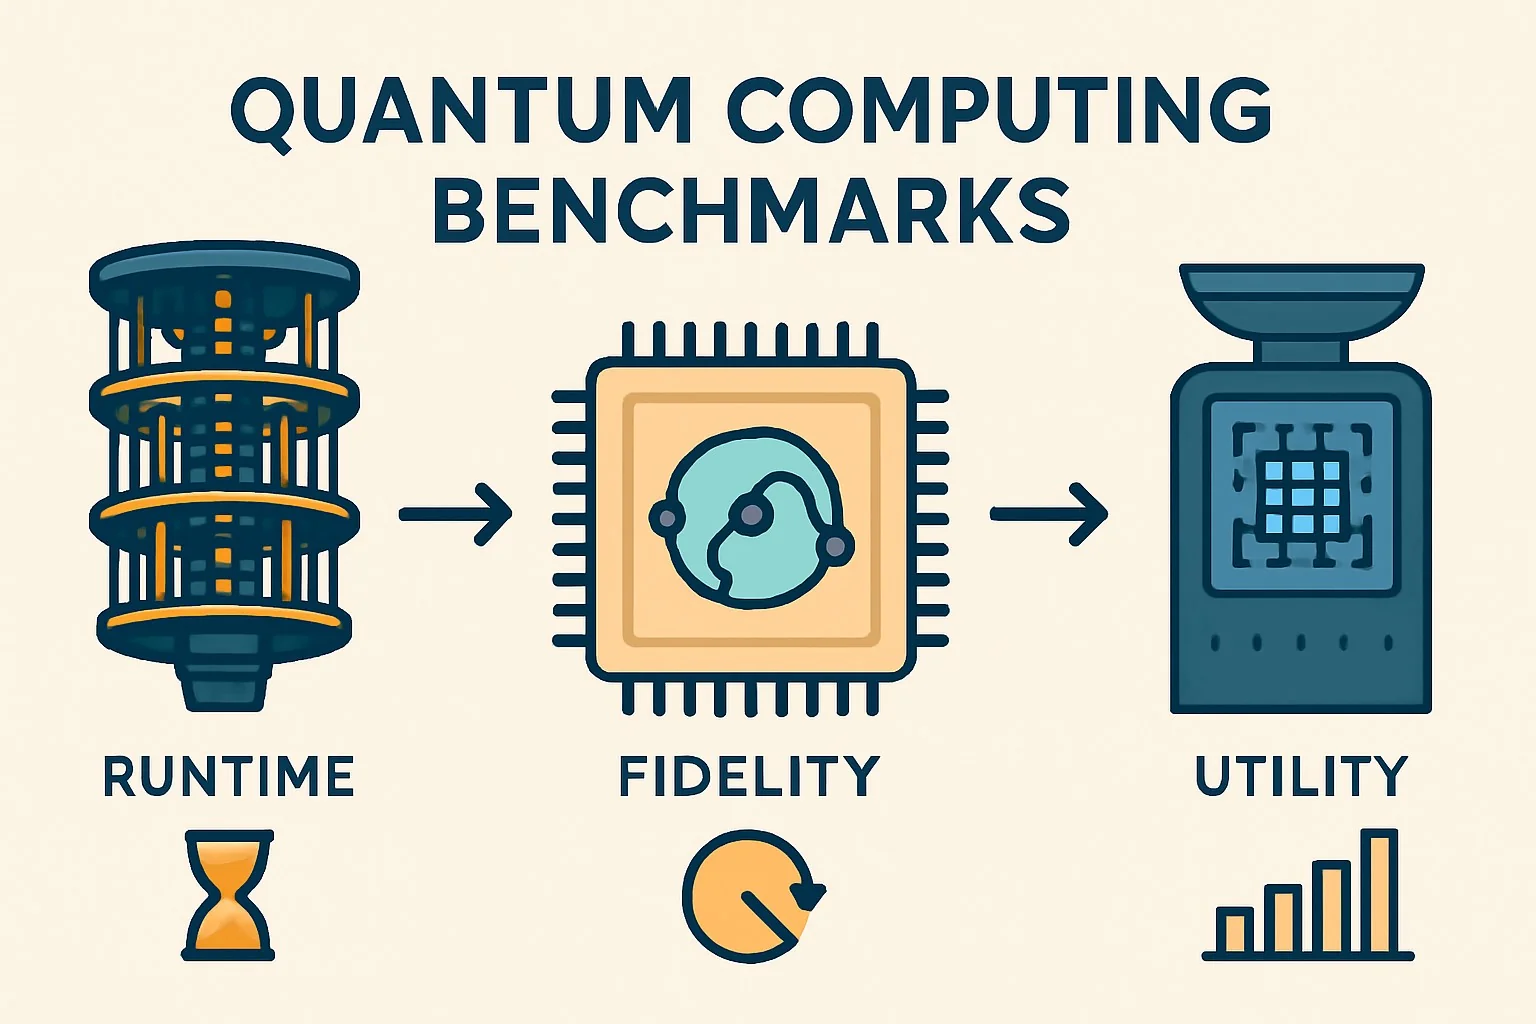
Quantum Computing Benchmarks: Runtime, Fidelity, Utility Compared
Introduction
When your team evaluates whether to port a quantum workload to IBM's Heron, Google's Sycamore, or IonQ's Forte, you face a measurement crisis: no single number captures whether the machine will actually solve your problem. Runtime, fidelity, and utility are measured with incompatible protocols, reported with inconsistent confidence intervals, and marketed with selective framing. This article delivers a production-ready framework for comparing quantum computing platforms using evidence-led metrics that survive procurement scrutiny and engineering due diligence.
Failure scenario: A financial services team selected a quantum annealer based on qubit count alone, ignoring coherence time and gate fidelity variance. Their portfolio optimization prototype produced correct results on 12% of runs, with no diagnostic to distinguish hardware error from algorithmic failure. Six months of debugging ended when an independent CLOPS benchmark revealed the chosen platform's effective circuit execution rate was 40× slower than a gate-based alternative with fewer qubits.
Executive Summary
TL;DR: Compare quantum computers using CLOPS for runtime throughput, quantum volume and circuit layer operations per second for fidelity-scaled capacity, and application-specific success probability for utility; never trust qubit count in isolation.
- Runtime benchmarks must measure wall-clock time for complete algorithm execution, not isolated gate times or theoretical clock speeds.
- Fidelity requires layered metrics: single-qubit gate fidelity, two-qubit gate fidelity, measurement fidelity, and state preparation and measurement (SPAM) fidelity, each with variance across qubits and time.
- Utility is the only metric that matters for procurement: probability of obtaining correct result for your specific problem instance, measured with statistical rigor.
- Cross-platform comparison demands normalized problem instances, not vendor-supplied demos optimized for their hardware topology.
- Benchmarks decay: hardware calibration drift and software stack updates can invalidate published numbers within weeks.
- Cloud access introduces latency and queuing that dominates runtime for small circuits; always benchmark through your actual access path.
Quick Q&A for direct answers:
- Q: What is the most important single metric for comparing quantum computers? A: Quantum volume (QV) or its successor, CLOPS, because they combine fidelity and connectivity into a problem-relevant figure; qubit count alone is misleading.
- Q: How do I benchmark runtime fairly across cloud platforms? A: Measure end-to-end wall-clock time from job submission to result retrieval for identical circuit instances, averaged over ≥100 runs at your access tier.
- Q: Why do two platforms with identical gate fidelity produce different results on my problem? A: Fidelity is typically reported as mean or best-case; your problem may stress worst-case qubits, connectivity bottlenecks, or calibration drift that variance metrics reveal.
How Quantum Computing Benchmarks Work Under the Hood
The Three Measurement Domains
Quantum computing benchmarks operate across three partially orthogonal domains. Understanding their separations prevents the common error of conflating fast gates with reliable computation, or reliable small circuits with scalable utility.
Runtime benchmarks measure temporal throughput: how quickly the system executes quantum operations and returns classical results. The foundational metric is CLOPS (circuit layer operations per second), introduced by IBM in 2021 and now widely adopted. CLOPS measures how many parameterized layers of a model circuit—specifically a hardware-efficient ansatz—execute per second, including compilation, queuing, and classical communication overhead. This deliberately includes software stack latency, punishing platforms with slow compilers or congested cloud queues.
Prior to CLOPS, the dominant runtime metric was simply gate time or T1/T2 coherence times. These remain relevant for hardware characterization but fail as procurement metrics because they ignore the classical control overhead that dominates wall-clock time for circuits below ~10^4 gates. Our deep-dive on quantum computer reliability metrics explores how coherence time interacts with error correction overhead in regimes where logical qubits become necessary.
Fidelity benchmarks quantify the probability that operations preserve quantum information. The hierarchy runs from single-qubit gate fidelity (typically 99.5–99.9% on leading platforms), through two-qubit gate fidelity (99.0–99.5% for best superconducting pairs, 97–99% for trapped ion), to measurement fidelity and SPAM (state preparation and measurement) fidelity. The critical insight: these fidelities multiply across circuit depth. A 100-gate circuit with 99.5% average gate fidelity has expected success probability ~0.995^100 ≈ 60%, before considering correlated errors or worst-case qubits.
Quantum volume (QV), developed by IBM and now standardized as IEEE P3129, addresses this multiplicative decay by measuring the largest square circuit (n qubits, n layers) that produces statistically significant heavy output generation. A QV of 2^n means the system successfully executes an n×n random circuit with >2/3 success probability against classical simulation. This folds fidelity, connectivity, and compiler efficiency into one number.
Utility benchmarks are application-specific metrics: the probability of obtaining the correct ground state energy for a molecular simulation, or the approximation ratio for a MaxCut variational quantum eigensolver (VQE) instance. These are the only metrics that predict production value, but they resist cross-platform comparison because problem encoding, ansatz choice, and classical optimizer interact with hardware characteristics in non-separable ways.
Benchmark Architecture: From Physics to Application
At the hardware layer, benchmarks measure physical parameters: T1 (energy relaxation time), T2 (dephasing time), gate duration, and gate fidelity via randomized benchmarking or interleaved randomized benchmarking. These are necessary for hardware development but insufficient for users.
The circuit layer introduces quantum volume, CLOPS, and application benchmarks like the QED-C (Quantum Economic Development Consortium) suite. These execute on the compiled circuit, including transpilation to native gates and mapping to hardware topology. The QED-C suite is particularly valuable for procurement because it specifies problem instances independent of hardware, enabling direct comparison across the growing population of cloud-accessible systems.
At the application layer, benchmarks like the Q-Score (Atos/Eviden) or application-oriented benchmarks from the Unitary Fund measure solution quality for specific problem classes. These are closest to utility but require expertise to interpret: a VQE benchmark result depends on ansatz depth, which trades quantum resource against classical optimization difficulty.
Implementation: Production Patterns
Pattern 1: Establishing Your Measurement Baseline
Before comparing platforms, fix your measurement protocol. Variation in benchmarking methodology exceeds cross-platform performance differences for many current workloads.
Step 1: Define your problem instance family. Select 3–5 problem instances spanning your operational range: small (verifiable by classical simulation), medium (your near-term target), and large (aspirational, for scaling projections). For optimization, this might be MaxCut on 3-regular graphs with 8, 16, and 32 nodes.
Step 2: Fix encoding and algorithm. The same MaxCut instance performs differently with QAOA (quantum approximate optimization algorithm) versus VQE, and with different ansatz depths. Document your choices; they become part of the benchmark.
Step 3: Automate execution and data collection. Use each platform's SDK to submit identical circuits, with retry logic for queue saturation and timeout handling. Record: submission time, queue time, compilation time, execution time, and result retrieval time separately.
# Example: Cross-platform runtime measurement framework (Qiskit + Braket + Cirq)
import time
from dataclasses import dataclass
from typing import List, Dict, Optional
import numpy as np

@dataclass
class BenchmarkResult:
    platform: str
    circuit_name: str
    n_qubits: int
    n_gates: int
    submission_time: float
    queue_time: float
    compile_time: float
    execution_time: float
    retrieve_time: float
    success_probability: Optional[float] = None
    raw_counts: Optional[Dict] = None

def measure_runtime(platform_executor, circuit, shots=1024, repeats=100):
    """
    Measure end-to-end runtime with component breakdown.

    platform_executor: callable with signature
        (circuit, shots) -> (job_id, result_counts)
    """
    results = []
    for i in range(repeats):
        t0 = time.perf_counter()
        job_id = platform_executor.submit(circuit, shots)
        t1 = time.perf_counter()

        # Poll for completion (platform-specific)
        status = platform_executor.poll(job_id)
        while status == 'QUEUED':
            time.sleep(0.1)
            status = platform_executor.poll(job_id)
        t2 = time.perf_counter()

        # Compilation may happen during queue or as separate step
        # Track via platform metadata where available
        compile_metadata = platform_executor.get_compile_metadata(job_id)
        t3 = time.perf_counter()

        counts = platform_executor.retrieve(job_id)
        t4 = time.perf_counter()

        results.append(BenchmarkResult(
            platform=platform_executor.name,
            circuit_name=circuit.name,
            n_qubits=circuit.num_qubits,
            n_gates=len(circuit.data),
            submission_time=t1 - t0,
            queue_time=t2 - t1,
            compile_time=compile_metadata.get('duration', t3 - t2),
            execution_time=compile_metadata.get('exec_time', t3 - t2),
            retrieve_time=t4 - t3,
            raw_counts=counts
        ))
    return results
Pattern 2: Fidelity Measurement with Variance Quantification
Published fidelity numbers are typically means or best-case values. For production reliability, you need distribution shape and temporal stability.
Execute randomized benchmarking (RB) or interleaved RB across all qubit pairs in your problem's connectivity graph, not just the best-connected subset. Record per-qubit and per-pair fidelity, then compute the effective circuit fidelity as the product of involved operation fidelities, weighted by occurrence count.
# Fidelity budgeting for a specific circuit instance
from collections import Counter

def circuit_fidelity_budget(circuit, gate_fidelities: Dict,
                            two_qubit_fidelities: Dict,
                            measurement_fidelity: Dict):
    """
    Compute expected fidelity for a specific circuit instance,
    accounting for which qubits and gates are actually used.

    Returns dict with component breakdown for diagnostic use.
    """
    gate_counts = Counter()
    qubit_measurement_counts = Counter()

    for inst in circuit.data:
        gate = inst.operation.name
        qubits = tuple(q._index for q in inst.qubits)

        if len(qubits) == 1:
            gate_counts[('1q', qubits[0], gate)] += 1
        elif len(qubits) == 2:
            gate_counts[('2q', qubits, gate)] += 1

    for q in circuit.qubits:
        qubit_measurement_counts[q._index] += 1

    fidelity_product = 1.0
    breakdown = {}

    for (gate_type, qubits, gate), count in gate_counts.items():
        if gate_type == '1q':
            fid = gate_fidelities.get(qubits, 0.999)
        else:
            fid = two_qubit_fidelities.get(qubits,
                       two_qubit_fidelities.get(tuple(reversed(qubits)), 0.995))

        component = fid ** count
        breakdown[f"{gate_type}_{qubits}_{gate}"] = {
            'per_op_fidelity': fid,
            'count': count,
            'contribution': component
        }
        fidelity_product *= component

    # Measurement contribution
    meas_component = 1.0
    for q, count in qubit_measurement_counts.items():
        fid = measurement_fidelity.get(q, 0.99)
        meas_component *= fid ** count

    breakdown['measurement'] = {
        'per_readout_fidelity': min(measurement_fidelity.values()),
        'contribution': meas_component
    }
    fidelity_product *= meas_component

    return {
        'expected_fidelity': fidelity_product,
        'breakdown': breakdown,
        'dominant_error_source': min(
            breakdown.items(),
            key=lambda x: x[1]['contribution'] if isinstance(x[1], dict) and 'contribution' in x[1] else 1.0
        )
    }
The dominant error source identification is critical for platform comparison: one platform may have superior single-qubit fidelity but worse two-qubit connectivity, making it inferior for your specific circuit topology despite higher headline numbers.
Pattern 3: Utility Measurement with Statistical Rigor
Utility benchmarks require ground truth or verifiable approximation bounds. For optimization, this means classical verification of optimal solutions for small instances, and approximation ratio bounds for larger instances.
# Utility measurement for MaxCut QAOA
from scipy.optimize import minimize
import networkx as nx

def benchmark_qaoa_utility(platform_executor, graph: nx.Graph,
                             p: int, shots: int = 8192,
                             classical_optimal: Optional[float] = None):
    """
    Measure QAOA utility for a specific graph instance.

    Returns approximation ratio if classical_optimal provided,
    else raw cut value distribution.
    """
    # Build QAOA circuit with p layers
    n = graph.number_of_nodes()

    def execute_circuit(params):
        beta, gamma = params[:p], params[p:]
        circuit = build_qaoa_circuit(graph, beta, gamma)

        # Transpile and execute on target platform
        counts = platform_executor.run(circuit, shots=shots)

        # Evaluate cut values
        cut_values = []
        for bitstring, count in counts.items():
            cut = evaluate_maxcut(graph, bitstring)
            cut_values.extend([cut] * count)

        return -np.mean(cut_values)  # Negative for minimizer

    # Optimize parameters (classical outer loop)
    from functools import lru_cache

    # Cache platform executions—expensive!
    execution_cache = {}

    def cached_execute(params_tuple):
        if params_tuple not in execution_cache:
            execution_cache[params_tuple] = execute_circuit(np.array(params_tuple))
        return execution_cache[params_tuple]

    # Use simulator for initial parameter guess, then fine-tune on hardware
    from qiskit_algorithms import QAOA
    from qiskit_algorithms.optimizers import COBYLA

    simulator = AerSimulator()
    qaoa = QAOA(sampler=SimulatorSampler(simulator), optimizer=COBYLA(), reps=p)
    result = qaoa.compute_minimum_eigenvalue(
        operator=Maxcut(graph).to_quadratic_program().to_ising()[0]
    )
    initial_params = list(result.optimal_point)

    # Hardware optimization with limited budget
    opt_result = minimize(
        lambda x: cached_execute(tuple(x)),
        x0=initial_params,
        method='COBYLA',
        options={'maxiter': 50, 'rhobeg': 0.1}
    )

    # Final evaluation with optimized parameters
    final_circuit = build_qaoa_circuit(graph,
                                       opt_result.x[:p],
                                       opt_result.x[p:])
    final_counts = platform_executor.run(final_circuit, shots=shots*4)

    # Compute statistics
    cut_values = []
    for bitstring, count in final_counts.items():
        cut = evaluate_maxcut(graph, bitstring)
        cut_values.extend([cut] * count)

    best_cut = max(cut_values)
    mean_cut = np.mean(cut_values)

    result = {
        'best_cut_value': best_cut,
        'mean_cut_value': mean_cut,
        'cut_value_p95': np.percentile(cut_values, 95),
        'optimal_parameters': opt_result.x.tolist(),
        'hardware_executions': len(execution_cache)
    }

    if classical_optimal:
        result['approximation_ratio'] = best_cut / classical_optimal
        result['mean_approximation_ratio'] = mean_cut / classical_optimal

    return result
The parameter optimization pattern—simulator pre-optimization, limited hardware refinement—is essential for fair comparison. Platforms with faster execution (higher CLOPS) can afford more optimization iterations, creating a runtime-fidelity-utility interaction that single-metric comparisons miss.
Comparisons & Decision Framework
Cross-Platform Comparison Matrix
When evaluating platforms for a specific workload, structure comparison across these dimensions:
| Dimension | Superconducting (IBM, Google) | Trapped Ion (IonQ, Quantinuum) | Photonic (PsiQuantum, Xanadu) |
|---|---|---|---|
| Runtime (CLOPS) | 10^3–10^5 (highest) | 10^1–10^3 (limited by gate speed) | 10^2–10^4 (theoretical, not yet realized) |
| Single-qubit fidelity | 99.9% | 99.99% | Varies by encoding |
| Two-qubit fidelity | 99.0–99.5% | 97–99.5% | 98–99% (cluster states) |
| Connectivity | Nearest-neighbor (heavy-hex) | All-to-all | Programmable |
| Coherence time | ~100 μs | ~1–10 s | ~1 μs (flying qubits) |
| Cloud queue latency | Minutes–hours | Minutes–hours | N/A (pre-release) |
| Best for | Deep circuits, fast iteration | Complex topologies, high fidelity | Networking, simulation |
Google's superconducting approach prioritizes speed and scale, while trapped ion platforms trade gate speed for connectivity and fidelity. The optimal choice depends on your circuit's depth, entanglement structure, and tolerance for queue latency.
Procurement Decision Checklist
Use this checklist when evaluating quantum computing platforms for production use:
- Problem fit: Has the vendor demonstrated your problem class, or only generic benchmarks? Request utility measurement on your problem instance or a published proxy.
- Metric completeness: Are runtime, fidelity, and utility all reported? Is fidelity reported as distribution or single number? Is runtime measured end-to-end or execution-only?
- Temporal stability: Are benchmarks time-stamped with calibration data? Can you access historical performance data for your access tier?
- Access path fidelity: Have you benchmarked through your actual cloud subscription, or are you using vendor-optimized direct access?
- Error budget closure: Does the fidelity breakdown identify your circuit's dominant error source? Can you mitigate via transpilation or error suppression?
- Scaling trajectory: Does the platform's roadmap address your circuit's scaling bottleneck (qubit count, connectivity, or error correction overhead)?
- Classical integration: What is the latency and cost of the classical-quantum feedback loop for variational algorithms?
For organizations assessing whether quantum computing is mature enough for their use case, our evidence-based reality check provides decision criteria based on 2024–2025 hardware and software milestones.
Failure Modes & Edge Cases
Failure Mode 1: Calibration Drift Invalidating Benchmarks
Symptom: Performance degrades 20–50% between morning and afternoon runs, with no code changes.
Diagnostic: Compare timestamped benchmark results against platform-published calibration data. Check if two-qubit gate fidelity on your problem's critical edges has drifted below threshold.
Mitigation: Execute benchmarks immediately before production runs, not relying on published numbers. Implement adaptive transpilation that remaps to best-calibrated qubits based on current calibration feed.
Failure Mode 2: Queue Saturation Distorting Runtime
Symptom: CLOPS varies 10× between access tiers; your benchmark results don't match published vendor numbers.
Diagnostic: Decompose runtime into submission, queue, compile, execution, and retrieval components. Queue time typically dominates for small circuits on popular platforms.
Mitigation: Benchmark at your actual access tier and time-of-day. Negotiate dedicated queue priority for production workloads, or select platforms with lower contention.
Failure Mode 3: Ansatz-Dependent Utility Inversion
Symptom: Platform A outperforms Platform B with one ansatz, but the ranking reverses with another.
Diagnostic: The ansatz's gate composition and connectivity requirements interact with platform-native gate sets and topology. A hardware-efficient ansatz may favor Platform A's native gates while a symmetry-preserving ansatz stresses Platform B's weaker two-qubit links.
Mitigation: Benchmark with your final ansatz choice, not generic proxies. Evaluate ansatz optimization as part of the platform selection process.
Failure Mode 4: SPAM Fidelity Dominating Shallow Circuits
Symptom: Measured utility is far below fidelity-budget prediction for circuits with <10 layers.
Diagnostic: State preparation and measurement errors are multiplicative with gate errors but often omitted from simplified fidelity products. For shallow circuits, SPAM can dominate.
Mitigation: Include SPAM in fidelity budgets. Use measurement error mitigation (symmetrization, matrix inversion) where platform-supported, but validate that mitigation doesn't introduce bias.
Failure Mode 5: Correlated Errors Beyond Independent Model
Symptom: Success probability falls exponentially faster than fidelity product predicts at depth >50.
Diagnostic: Crosstalk, spectator qubit effects, and temporal correlations violate the independent error model underlying simple fidelity products. Detect via simultaneous randomized benchmarking or cross-resonance tomography.
Mitigation: For deep circuits, demand error correction or error suppression (dynamical decoupling, pulse optimization). Benchmark logical error rates, not physical gate fidelities, in this regime. Error correction stack selection becomes the dominant decision factor.
Performance & Scaling
Benchmark Targets for 2024–2025
Based on published results and verified cloud measurements, current production-relevant targets are:
- CLOPS: Leading superconducting platforms achieve 10,000–100,000 CLOPS; trapped ion platforms 100–1,000 CLOPS. For variational algorithms with 100+ parameter iterations, this difference dominates wall-clock time.
- Quantum Volume: Production systems range from QV 2^10 (1,024) to 2^20 (1,048,576). For circuits requiring >20 qubits with full connectivity, verify that QV was measured with heavy output generation, not just qubit count.
- Utility (optimization): QAOA approximation ratios of 0.7–0.85 on 3-regular MaxCut with p=1–3 layers, measured against classical optimal. Higher ratios require problem-specific tuning.
- Utility (simulation): Molecular ground state energy accuracy within 1 kcal/mol (chemical accuracy) for H2O in minimal basis with 14 qubits; this remains challenging for unmitigated NISQ hardware.
Scaling Laws and Projections
For circuit depth d and n qubits with average gate fidelity F, independent error model predicts success probability ~F^(n·d·g) where g is average gates per qubit per layer. This exponential decay motivates error correction: logical qubits with error rate ε_L enable circuits of depth ~1/ε_L rather than ~1/(n·d·g·(1-F)).
The crossover point where error correction becomes advantageous depends on physical error rate, code overhead, and decoding speed. For surface codes with ~10^3 physical qubits per logical qubit at 10^-3 physical error rate, the crossover is ~10^3–10^4 gates. Logical qubit reliability metrics track this transition, which defines the boundary of NISQ utility.
Monitoring Recommendations
Implement continuous benchmarking for production quantum workloads:
- Calibration probe: Run a 5-minute randomized benchmarking sequence at job start to detect drift.
- Canary circuit: Include a classically-verifiable sub-problem instance in production batches to detect systematic errors.
- Latency tracking: Log queue and compile time components; alert on p95 degradation indicating platform congestion.
- Result distribution monitoring: Track output entropy and bitstring concentration; anomalous distributions indicate calibration or control errors.
Production Best Practices
Security and Access Control
Quantum cloud access introduces unique security considerations: circuit submission reveals algorithmic intent, and result interception compromises competitive advantage. Use platform-native encryption for circuit description and result retrieval. For sensitive workloads, evaluate on-premise quantum hardware or private cloud deployments.
Post-quantum cryptography for classical control channels is essential for long-term security, though current quantum computers lack the scale to break RSA or ECC directly. Our PQC performance guide quantifies the TLS overhead for securing quantum-classical communication.
Testing and Validation
Validate quantum results through:
- Classical simulation: For ≤20 qubits, compare against exact or tensor-network simulation.
- Symmetry checks: Verify that results respect problem symmetries (e.g., particle number conservation in chemistry).
- Consistency across shots: High-variance result distributions indicate insufficient shots or hardware instability.
- Cross-platform replication: Execute on two independent platforms for critical results; divergence indicates systematic error in one.
Runbook: Benchmark Degradation Response
When production benchmark metrics degrade:
- Check platform status page for known calibration or maintenance events.
- Re-run calibration probe; if fidelity degraded >10% from baseline, pause production and re-transpile to alternative qubit mapping.
- If queue latency increased >2×, check access tier limits and consider job batching or tier upgrade.
- Document incident with timestamped benchmark data for platform vendor escalation.
- Evaluate fallback to alternative platform if degradation persists >24 hours.
Further Reading & References
- IBM CLOPS definition and measurement protocol: Wack et al., "Quality, Speed, and Scale: three key attributes to measure the performance of near-term quantum computers," arXiv:2110.14108 (2021). Defines the CLOPS metric and demonstrates measurement methodology.
- Quantum Volume standardization: Cross et al., "Validating quantum computers using randomized model circuits," Physical Review A 100, 032328 (2019). Original QV paper; now progressing through IEEE P3129 standardization.
- QED-C Application Benchmarks: Quantum Economic Development Consortium, "Application-Oriented Benchmarks for Quantum Computing" (2023–2024). Cross-platform benchmark suite with problem-independent specifications.
- Google Quantum AI Supremacy and beyond: Arute et al., "Quantum supremacy using a programmable superconducting processor," Nature 574, 505–510 (2019); subsequent papers on error correction and logical qubits (2022–2024).
- IonQ fidelity and connectivity characterization: IonQ technical publications and QED-C benchmark submissions (2023–2024). Demonstrates all-to-all connectivity advantages for specific problem classes.
- Unitary Fund Metriq platform: metriq.info — community-driven benchmark repository with time-series data and cross-platform comparison tools.
For organizations tracking the expanding quantum computing ecosystem, our verified 2026 hardware census provides current counts and access pathways for benchmarking across platforms.


